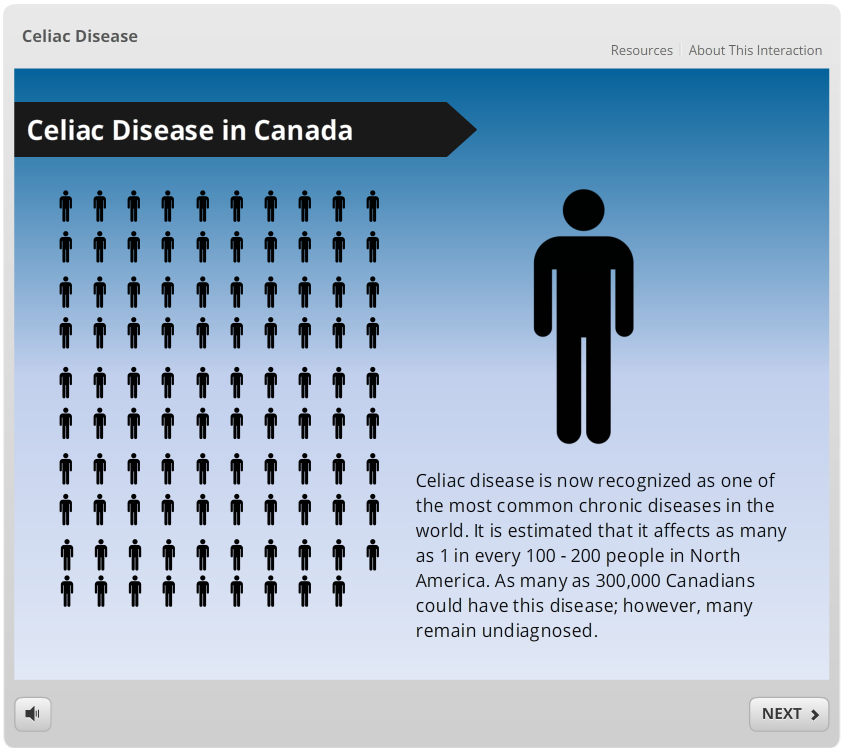
The focus of this E-Learning Heroes Challenge was to build a static infographic as interactive graphics. For this challenge I worked with information about Celiac Disease. The source of my inspiration was this infographic however I modified the information to represent Canadian Data. I also used inspiration from the E-Learning Heroes website and incorporated an animated circle graph.
View the Interaction
Check out the Storyline file to view all of the infographics incorporated into this piece.
